
The complete public packet
The instructional text, order, mathematics, worked problem, answer, warnings, and diagrams below match the published PDF excerpt. Only the cover, repeating page furniture, page breaks, and responsive layout differ on the web.
BEFORE YOU COMPUTE
About this guide. This is a Unit 3 guide for AP Business with Personal Finance — the money unit. It covers Part 1, Personal Saving and Borrowing, and Part 2, Business Finance and Accounting. Those two halves carry 25–35% of the multiple-choice section, the largest single band on the exam, and between them they hold nearly everything in the course you can actually compute.
The habit this unit asks for is not one most courses teach. In most subjects a number is an answer. Here a number is a claim, and your job is to say what it means and what it leaves out. “Revenue grew 16%” is not good news until you know what happened to costs. “The account pays 5%” is not a rate until you know 5% of what, how often, and against what inflation. So every problem in this guide ends the same way: a number, and then a sentence in plain English saying what the number means for the person or the business that has to live with it. If you can produce the number but not the sentence, you have done the arithmetic and skipped the subject.
A note on scope, because the course is new. AP Business with Personal Finance launches nationally in fall 2026 and the first exam is scheduled for May 2027. This guide is aligned to the published Course and Exam Description (effective fall 2026). (A naming note, since it will trip up anyone searching: some earlier press coverage calls this course AP Business Principles or AP Business Principles with Personal Finance. College Board’s own course page, exam page and CED all call it AP Business with Personal Finance — that is the name to search on.) The vocabulary here — assets, liabilities, net worth, COGS, gross and operating and net profit, fixed and variable costs, break-even, APR — is the framework’s own, quoted from its topics and learning objectives. But no exam has been administered, so nobody has seen a released one, including us. The published format is known: 60 multiple-choice questions in 70 minutes (60%) and four free-response questions in 90 minutes (40%) — a Canvas validation task, a personal-finance application, a business-concept application, and a business decision. Official samples show the intended evidence-and-reasoning work; they are not an administered question bank. This is therefore a unit guide, not a prediction of recurring exam prompts: it works the concepts the unit is built on, in the unit’s own terms.
Two more honesty flags you will see used in place throughout. Where a piece of arithmetic is standard financial practice rather than something the framework spells out — the compound-interest formula itself, the contribution-margin shortcut, an amortisation schedule, the Rule of 72 — the guide says so at the point of use. The framework requires the idea in each of those cases, and Skill 1.B asks you to “interpret quantitative and qualitative business and personal financial data, performing calculations as appropriate” — but it does not hand you the algebra. I hand you the algebra, because a formula you cannot rebuild is a formula you will misuse. And where a topic sits in Unit 5 — pay stubs, budgeting, insurance, diversification — it is marked, because Unit 5 is explicitly not assessed on the AP Exam. It is in here anyway. Unit 5 is the part of this course you will use every month for the rest of your life, and the exam’s silence about it is a fact about the exam, not about the material.
Every scenario and every business in this guide is fictional. Nothing here is investment advice: there are no product recommendations and no claims about what any investment will return. What there is, is arithmetic, carried through with the units attached.
Use the decision tree when the prompt feels unfamiliar, or jump straight to the symptom map after it when you already know what is blocking you. Then work each problem before reading its solution — the “Before you compute” notes are there to catch you at the exact moment a wrong turn usually happens.
Diagnostic Decision Tree
READ THE NUMBERS BEFORE YOU TOUCH THEM
Many quantitative prompts in this unit offer one of three useful starting points, and each has its own first question. Ask which route fits before you compute — a correct procedure applied to the wrong kind of evidence still produces a wrong answer.
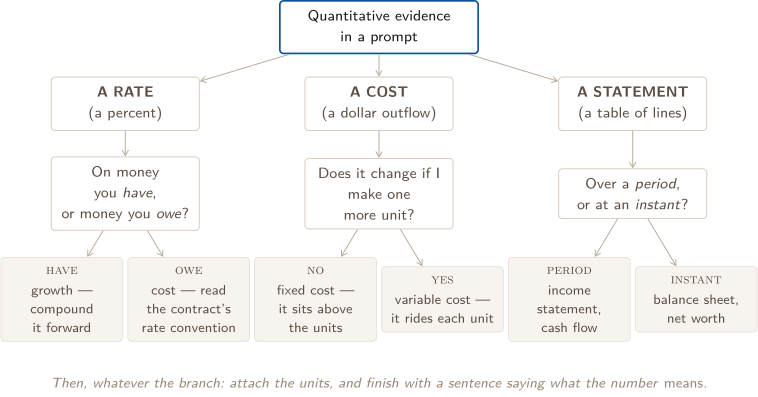
THE FOUR QUESTIONS, IN ORDER
1. If it is a rate — a percent of what, over how long? A percent with nothing attached is not information. 6% could be six percent per year, per month, or over the whole life of a loan, and those differ by a factor of twelve or worse. So before anything: write the rate as a decimal, name its period, and identify how the prompt says interest is posted. If a simplified problem states that a nominal 22.9% annual rate is divided evenly across twelve monthly periods, its monthly rate is . A quoted APR by itself, however, does not tell you every contract detail; use the convention the prompt or lender supplies.
2. If it is a cost — does it move when volume moves? This is the only sorting question that matters for costs, and it is worth more than the vocabulary it produces. Rent does not care whether you sold three units or three thousand: fixed. Leather for a wallet appears once per wallet: variable. The framework also sorts costs a second way, direct versus indirect (Topic 3.4), and those two sorts are independent — factory rent is direct and fixed at the same time. Both cuts are useful; only the fixed/variable cut tells you where the break-even point is.
3. If it is a financial statement — period or instant? An income statement and a cash flow statement cover a stretch of time: what happened between January and December. A balance sheet is a photograph at one moment: what was owned and owed on 31 December. This is why you can never read profit off a balance sheet or net worth off an income statement, and why a business can be profitable and still run out of cash. Ask which one the question is holding before you look for a number in it.
4. Then finish the job: what does the number mean? The task verb is the tell, and the framework defines six. Identify asks for specified information without elaboration. Describe asks for relevant characteristics. Compare asks for similarities and/or differences. Explain asks how or why, using evidence and/or reasoning. Recommend asks for a course of action supported by evidence. Pitch asks you to present a product, identify its target customer and the problem, need, or want it addresses, and explain its value to that customer.
Quantitative evidence can appear under any of those verbs when the prompt supplies it. Match the amount of explanation to the verb: do not bury an identify response in an essay, and do not stop an explain or recommend response at an unsupported number. A useful full sentence has the shape: this number, computed this way, means this for this household or business.
WHERE TO LOOK WHEN YOU ARE STUCK
This guide is a reference, not a prerequisite wall. Start with the row that sounds like your symptom; a page number appears when that target is inside the file you are reading.
SYMPTOM MAP · CONTINUED
What you notice | First move | Go there |
|---|---|---|
A percent or growth rate | Name its base, period, and posting convention | Rate toolbox (p. 10); Problems 1–3 |
A string of timed deposits | Put every cash flow on a dated timeline | Deposit toolbox (p. 11); Problem 2 |
A loan or revolving balance | Write one period: interest, payment, new balance | Problem 5 |
Revenue and several cost lines | Build the income-statement ladder before ratios | Problem 6 |
Price, unit cost, and fixed cost | Find contribution per unit, then cover fixed cost | Problem 7 |
Profit is positive but cash is tight | Separate accrual profit from cash collected and paid | Cash-flow toolbox (p. 20); final case |
A loan-versus-equity choice | Compare repayment, ownership, control, and risk | Capital toolbox (p. 19); final case |
A reporting or control dilemma | Name the stakeholder, incentive, principle, and safeguard | Ethics toolbox (p. 21); final case |
Several personal goals compete | State assumptions, price each option, then recommend | Problem 8 |
Master Toolbox — Everything These Problems Use
WORKING WITH MONEY ON A FOUR-FUNCTION CALCULATOR
Start here, because it changes what the other tools have to look like. College Board’s exam page says the AP Business with Personal Finance Exam permits a four-function calculator — either a handheld one or the four-function Desmos built into Bluebook, since the exam is fully digital. A four-function calculator adds, subtracts, multiplies and divides; most also do square roots and a percent key. Do not plan on an exponent key.
That single fact tells you what kind of arithmetic can possibly be asked, and it is worth taking seriously rather than resenting. Nobody is going to make you evaluate by hand. What you will be asked to do is read a rate correctly, apply it to the right base, run a few periods forward, and say what came out. So these are the moves worth having automatic:
- Percent to decimal, always, first. . Divide by 100 and never think in percent again until you print the answer. Mixing the two forms mid-calculation is the single most common arithmetic error in this unit.
- Name the rate convention before converting. Divide a nominal annual rate by the number of periods only when the prompt or contract says it is allocated that way. Effective annual rates already include compounding; a quoted APR alone does not specify every posting convention.
- One period of growth is one multiplication. New balance old balance . Two periods is that twice. On a four-function calculator, periods is the key pressed times, which is exactly what the exponent means — the notation is shorthand for the keystrokes, not a different operation.
- Interest for one period is one multiplication too: balance period rate. Everything about loans is built from that one line repeated.
- Round once, at the end. Carry every decimal your calculator will hold and round the final answer to the cent. Rounding an intermediate value and then building on it is how you end up a few dollars off with no idea where it went. The one deliberate exception is a quoted figure — a lender’s monthly payment is rounded to the cent by the lender before you ever see it, so a payment schedule built on it is built on the rounded number, on purpose.
- Break-even units round up, never to nearest. You cannot sell 1,142.4 wallets, and at 1,142 you are still short. Problem 7 shows exactly how much this costs if you get it wrong.
- Carry the units. Dollars, dollars per unit, units, dollars per month, percent per year. A dimension check catches more errors in this subject than a second run of the arithmetic: if you divide dollars by dollars-per-unit and do not get units, something upstream is wrong.
INTEREST: THE FOUR THINGS THAT PIN DOWN ANY RATE
Any interest calculation is fixed by four inputs, and if you can name all four you can compute; if you cannot, no formula will save you. Principal (), the amount you start with or borrow. Rate (), always as a decimal, always with a period attached. Time (), counted in those same periods. Compounding — whether the interest earned so far starts earning too.
Simple interest leaves the interest out of the calculation after it is earned. Every period you compute interest on the original principal:
The balance grows by the same dollar amount every period, so it plots as a straight line.
Compound interest puts the interest back in. Each period you compute interest on everything currently there:
Problem 1 derives this line by line rather than asserting it, because the exponent is doing something specific and students who memorize the formula routinely misread what.
Honesty flag. The framework requires compounding as an idea — Unit 5 states that people who start young and hold assets a long time realise greater returns due to compounding, and the National Standards for Personal Financial Education (which this course adopts in full) speak of higher rates producing greater compound interest for savers. The framework does not print . That algebra is standard financial arithmetic, supplied here because the idea is untestable in your own head without it.
Compounding frequency, and the two rates it produces. A bank that quotes “4.9% compounded monthly” is not paying 4.9% over the year. It is paying twelve times, each on a balance the previous one already grew. The quoted figure is the nominal annual rate; what you actually earn over a year is the effective annual rate:
Two quoted rates with different compounding frequencies cannot be compared until both are converted. That is the entire content of Problem 3. (For borrowing, the framework’s own vocabulary is APR — Credit standard 12-1 says borrowers compare the cost of credit using the Annual Percentage Rate and the other terms in the contract. In Problem 5 the simplified contract explicitly posts one twelfth of the quoted annual rate each month. Outside a problem that states that convention, read the agreement: APR is a comparison measure, not a complete description of how and when interest is charged.)
Nominal versus real: the third rate. Inflation is an increase in prices, so it erodes what a dollar buys (Essential Knowledge 3.1.B.2). A balance that grew 5% in a year when prices rose 3% bought you about 2% more, not 5% more. Subtracting is a good approximation at ordinary rates; the exact version divides:
The case worth burning in: if the rate you earn is below inflation, your balance rises and your purchasing power falls. Saving standard 12-4 says exactly this, and Problem 3 puts a dollar figure on it.
The doubling shortcut (Rule of 72). Divide 72 by the interest rate written as a whole number and you get roughly the number of periods to double. At 6%: years. The exact answer is 11.9 years, so the approximation is good to about a percent in this range — and it is an approximation, an arithmetic convenience with no standing in the framework, not a result. Its value is that it lets you sanity-check a compound-growth answer in your head, which on an exam with a four-function calculator is worth more than it looks.
ADDING UP A STREAM OF DEPOSITS, AND WHERE THAT FORMULA COMES FROM
Problem 2 needs something the previous box does not give you: not one lump sum growing, but a deposit every year, each one growing for however long it has left. You could add up ten terms by hand, and you should, once — but there is a closed form, and rebuilding it takes three lines and removes all the magic.
Deposit at the end of each year for years, at rate per year. The last deposit has grown for zero years, the one before it for one year, and so on back to the first, which has grown for :
Write and factor out , and the bracket is a plain geometric sum . Multiply it by , and every term shifts one place:
Subtract. Everything in the middle cancels, leaving , so and
Honesty flag, and read it carefully: this formula is not in the course framework, and no AP Business with Personal Finance question is going to require it — you could not evaluate it on a four-function calculator anyway. It is here because Problem 2 makes a claim about saving early that is worth proving rather than repeating, and proving it needs this. Two things to notice about the derivation, both of which outlast the formula. The cancellation is the whole trick, and it works for any geometric sum. And the phrase “deposits at the end of each year” is not decoration — move the deposits to the beginning of each year and every one of them earns an extra year, multiplying the whole answer by . Timing conventions are where these calculations actually go wrong.
SAVING VEHICLES: RETURN IS ONLY ONE COLUMN
Topic 3.1 asks you to compare where saved cash sits, not merely which advertisement prints the largest rate. A checking account is built for frequent transactions and usually pays little or no interest. A savings account keeps cash accessible while paying interest. A money market deposit account may pay more but can require a higher balance or limit convenient access. A certificate of deposit trades liquidity for a stated term and rate; withdrawing before maturity can trigger a penalty.
For each choice compare return, fees, minimum balance, liquidity, and risk. Eligible deposits at covered institutions have government insurance within applicable limits; stocks, bonds, mutual funds, and other investments are not bank deposits and can lose value. A one-month reserve therefore belongs somewhere liquid and dependable, while money with a long horizon can tolerate different access and risk. Problem 3 shows why fees can outweigh a tiny rate difference.
CREDITWORTHINESS: THE LENDER IS PRICING DEFAULT
For a consumer loan, the lender asks how likely repayment is. The evidence includes income and savings, existing debt, and a credit report showing accounts and payment history; a credit score summarizes parts of that history. Higher income or savings, lower existing debt, and a record of on-time payments generally reduce perceived default risk. Higher risk can mean a higher interest rate or a refusal to lend (3.2.B.1–B.4).
Credit reports come from credit bureaus, and errors should be disputed. Paying on time, reducing debt, and avoiding unnecessary use of available card credit can improve creditworthiness over time (3.2.C.3–C.5). Do not confuse this consumer analysis with a business lender’s related but separate review in Topic 3.5: there the evidence includes business cash flow, projections, purpose, leadership, and capacity to repay.
WHO PREPARES THE NUMBERS, AND WHO DECIDES WITH THEM
Accounting records transactions and prepares reliable financial information. Managerial accountants build internal information for planning, control, and decisions; financial accountants prepare information for external stakeholders such as lenders and investors. Finance then analyzes the business’s position, evaluates alternatives, and recommends how to raise and use money (3.3.A–B).
Those jobs overlap, but they are not interchangeable: recording a payable faithfully is an accounting responsibility; deciding whether the firm can afford the resulting payment is a financial-management decision. Publicly held corporations disclose financial statements under generally accepted accounting principles (GAAP), which support consistent, comparable reporting. That public-company boundary does not mean every private firm has the same filing or independent-audit requirement.
ASSETS, LIABILITIES, NET WORTH — THE IDENTITY EVERYTHING HANGS ON
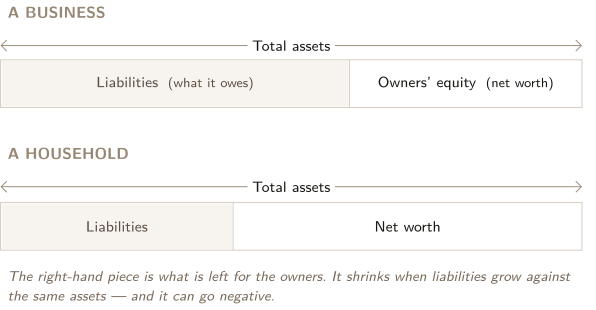
Four words that slide around under pressure, held in place by one equation. An asset is something owned that has value. A liability is something owed. What is left over when you settle up is net worth — called owners’ equity when the thing in question is a business. The framework states the identity twice, once for each, both times in words: assets equal liabilities plus owners’ equity (Essential Knowledge 3.7.A.1), and personal net worth is assets minus liabilities (Essential Knowledge 3.7.C.1). Written in symbols — my notation, not the framework’s — that is
Those are the same statement rearranged, which is the point of the figure below: everything a business owns was paid for either by somebody it owes or by its owners, so the two sides describe the same pile of value from opposite directions.
One more word from the same topic, because it decides which assets are actually useful in a crisis: liquidity is the ease with which an asset can be turned into cash (3.7.A.2.i). A balance sheet groups current assets such as cash, receivables, and inventory apart from long-term assets such as equipment and facilities; intangible assets can include legally recognized intellectual property. It likewise separates current liabilities such as near-term payables from long-term debt. Owners’ equity includes owner investment and earnings retained in the business rather than distributed.
Two snapshots become useful when compared: did liquidity, debt, or equity improve? One immediate test is
Positive working capital suggests near-term assets cover near-term claims; negative working capital is a warning about payment capacity, not by itself proof of failure. Two businesses can hold identical total assets and face different pressure because only one can reach enough value this week. Problem 8 uses the household version; the final case uses the business version.
THE INCOME STATEMENT, TOP TO BOTTOM
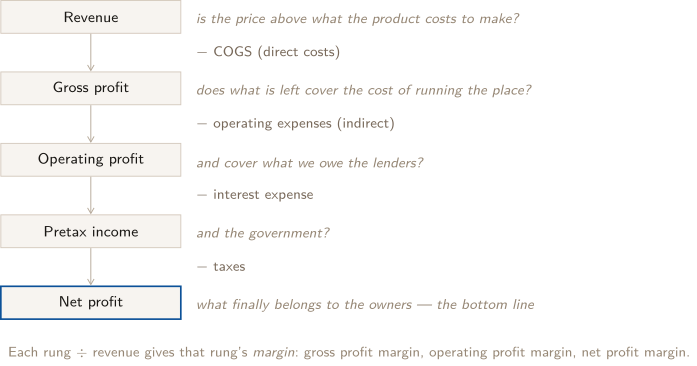
An income statement (also called a statement of profit and loss) compares total revenue to total costs over a period to find profit or loss. It is not a list. It is a ladder, and each rung answers a different question about the same business — which is why a business can look healthy on one rung and sick two rungs down.
THE INCOME STATEMENT, IN SYMBOLS AND IN RATIOS
The ladder, written out, with the framework’s own names (Topic 3.6):
| Line | How it is built |
|---|---|
| Revenue | income from the business’s core activities |
| Cost of goods sold (COGS) | direct costs of producing what was sold |
| Gross profit | revenue COGS |
| Operating expenses | indirect costs: selling, G & A, R & D |
| Operating profit | gross profit operating expenses |
| Interest expense | the cost of borrowed money |
| Pretax income | operating profit interest expense |
| Taxes | paid on positive pretax income |
| Net profit | pretax income taxes |
Three margins, all of them a rung divided by revenue, each one named by the framework (3.6.B.2, 3.6.B.3, 3.6.B.4) and each diagnostic of something different:
Gross margin is about pricing and direct costs. Operating margin adds how well the place is run. Net margin is everything, including the loan and the tax bill. A margin is only meaningful against something — last year, the plan, or a competitor (3.6.B.5) — so a single margin quoted alone tells you very little.
And the framework gives you the comparison tool explicitly (3.6.B.6):
Note what is in the denominator: the initial value, always. Using the current value instead is the most common error with this formula and it produces an answer that is close enough to look right.
Worth knowing what that display is. Percent change is one of the explicit quantitative relationships in the Course and Exam Description. Several other displays in this guide — the compound-interest and annuity forms, contribution margin, and the loan-payment formula — are standard financial arithmetic supplied here and flagged where they are used. The important distinction is not whether a formula is printed in the CED; it is whether you can explain what its numerator, denominator, and units mean.
And one scope note, because it saves you worrying about the wrong things. Topic 3.6 draws its own boundary: adjustments to net sales, what exactly goes into cost of goods sold, nonoperational income and expenses other than interest, and anything below the bottom line are all “beyond the scope of the AP Business with Personal Finance Exam.” The ladder above is the whole of what you are accountable for.
One boundary worth knowing. Percent change is undefined when the initial value is zero, and it behaves badly when the initial value is near zero or negative — a loss of $100 becoming a loss of $50 is a 50% “increase” by the formula, which is nonsense as English. When the base is small or negative, report the change in dollars and say so.
COSTS, AND THE BREAK-EVEN MACHINERY
The framework’s cost vocabulary (Topic 3.4), and then the arithmetic it enables.
Costs sort two independent ways. Direct costs are tied to producing or delivering a specific good or service — for a manufacturer these are cost of goods sold; for a service business, cost of sales. Indirect costs, which the framework also calls operating expenses, are the costs of running the business at all: occupancy, office and sales salaries, marketing, utilities, insurance. Separately, costs are fixed if they do not change with production or service levels, and variable if they rise as volume rises. The two sorts cross freely: factory rent is direct and fixed, raw materials are direct and variable, the marketing budget is indirect and usually fixed.
Startup costs (3.4.A) are their own category: one-time expenditures such as legal, incorporation and licensing fees, plus the initial expenses of getting going. They matter because they are spent before any revenue exists, which is exactly why 3.5.A.2 says an entrepreneur works out how many units must sell in a period to break even before deciding how much outside capital to raise.
Break-even. The framework requires the calculation — 3.5.A.2 has entrepreneurs “calculating how many goods or services they would need to sell in a period to break even (cover all costs for the period)” — and defines break-even as covering all costs. It does not print the shortcut, so here it is, with its reasoning attached rather than as a rule to memorize.
Sell one more unit and you collect the price and pay that unit’s variable cost. What is left over is the only money available to chip away at the fixed costs, and it has a name:
Fixed costs do not move, so you break even at the volume where the contributions have exactly covered them:
The units check: dollars divided by dollars-per-unit gives units. Above every further unit’s contribution is profit; below it, every missing unit’s contribution is loss. And in dollars of sales rather than units, divide by the contribution margin ratio, :
Two habits. Round up, always — at the fractional volume you are still a few dollars short. And state the period: break-even is per month or per year depending on the period of the fixed costs, and a break-even number with no period attached is not an answer.
The margin of safety is how far current volume sits above break-even, — the fraction of sales you could lose before the business stops covering its costs. It is not framework vocabulary; it is the number an operator actually watches, and it is one subtraction away from something you already have.
FINANCIAL CAPITAL: CASH ALWAYS ARRIVES WITH A CLAIM
A business may need outside money to launch, survive until customers pay, buy long-lived assets, or expand (3.5.A). The source changes with the business: a founder may bootstrap or use personal credit; friends and family may fund an early idea; a bank is more plausible after revenue and repayment capacity exist; established corporations can issue bonds or stock (3.5.B).
The durable comparison is debt versus equity. Debt requires repayment plus interest but usually leaves ownership and operating control with the current owners. Equity has no contractual interest or principal payment, but the investor receives an ownership claim, possible voting influence, and a share of future value or profit. Lenders earn interest and risk default; equity investors can gain more if the company succeeds and can lose their investment if it does not (3.5.C).
A credible funding request states the amount and purpose, the customer and value proposition, market evidence, financial projections and risks, and why the leadership can execute. A lender emphasizes capacity to repay; an equity investor emphasizes the possible future value of the ownership claim (3.5.D). “No payment this year” therefore does not mean “free,” and “keep control” does not mean “safe for cash.”
CASH FLOW: THE STATEMENT PROFIT CANNOT REPLACE
An income statement asks whether revenue exceeded expenses over a period. A cash flow statement asks whether cash actually arrived in time to meet cash payments. At the course’s level, construct it directly:
Inflows can include customer collections, investment income, asset sales, and new borrowed or invested capital. Outflows can include payments to employees and suppliers, interest, taxes, asset purchases, debt principal, and distributions to owners (3.8.A).
Timing is why net profit and net cash flow can have opposite signs. A sale can create revenue before its customer pays; equipment or loan principal can consume cash without being an expense on this period’s simplified income statement. Managers, lenders, investors, and suppliers use the statement to judge whether the business can meet obligations. Persistent negative cash flow can require faster collection, slower payment terms, lower outflows, or additional capital (3.8.B). The final case constructs the statement rather than merely naming it.
TRUST IN REPORTING: INCENTIVE, HARM, SAFEGUARD
Financial information affects loans, investment, tax, pay, and ownership, so people can have incentives to distort it. The course names misuse of funds, tax evasion, embezzlement, bribery, lack of transparency, fraud, and falsified statements. A technically convenient omission can still be misleading when it changes what a lender or investor believes about the business (3.9.A).
Analyze a reporting choice in four moves: who has the incentive; what fact is distorted; which stakeholder is harmed; what safeguard makes the record reliable. Safeguards include law, professional principles of honesty, integrity, transparency, objectivity, and confidentiality, plus internal codes, independent review, audits, reconciliations, approvals, and cash-handling controls (3.9.B). Publicly held corporations are subject to an annual independent-audit requirement; do not silently extend that specific requirement to every private business. The correct response to a misleading entry is to record and disclose the transaction truthfully, then strengthen the control that allowed the pressure to reach the record.
RISK: WHAT YOU KEEP, WHAT YOU HAND OFF, WHAT DIVERSIFICATION BUYS
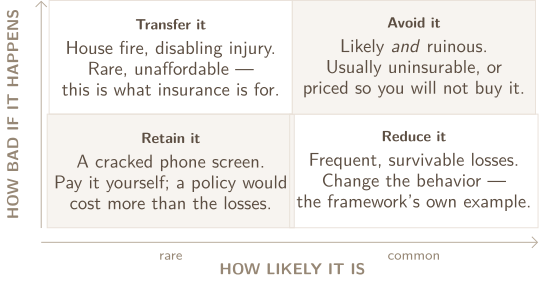
Unit 5 material (Topic 5.2, Managing Personal Risk) — not assessed on the AP Exam — with one foot in Unit 3, which is. The framework has businesses and consumers buying insurance to protect against financial losses, and notes that both “vary in their willingness to accept risk and/or pay for insurance to minimize risk” (3.4.B.6). Unit 5 goes further: a risk is insurable when the loss is due to chance and is quantifiable and statistically predictable, so an insurer can estimate its cost and likelihood (5.2.A.2). Read that definition backwards and it tells you why some risks — your business failing because customers stopped wanting the product — cannot be insured at all.
The mechanics are four words. A premium is what you pay, monthly or annually, to hold the policy. Coverage is the maximum the insurer will pay. A claim is your request for reimbursement after a loss. A deductible is the portion you pay yourself before coverage starts — and it is the dial that matters, because 5.2.C.3 is explicit that a person with higher risk tolerance may choose a higher deductible, accepting more out-of-pocket cost if something happens. That is not a loophole; that is the product working as designed.
Which brings out the idea underneath all of it: insurance is not protection from loss, it is the exchange of an uncertain large loss for a certain small one. You will pay the premium every year. Most years nothing happens and the money is gone. You buy it anyway when the loss you are avoiding would be one you could not absorb. Which sorts risks by two questions, not one — how likely, and how bad — and the answer is different in each corner.
DIVERSIFICATION, STATED CAREFULLY
Unit 5 material (Topic 5.3, Saving and Investing) — not assessed on the AP Exam. The framework’s position is precise and worth quoting rather than paraphrasing: financial assets vary in potential risk and expected return; assets that are government insured or provide guaranteed income are lower risk and typically carry lower expected returns; individual stocks are higher risk because their value depends on the success of one business (5.3.B.3). Diversification means allocating funds across a variety of assets with different levels of risk and expected return, and it “allows investors to seek higher long-term returns without taking on excessive risk” (5.3.C.5).
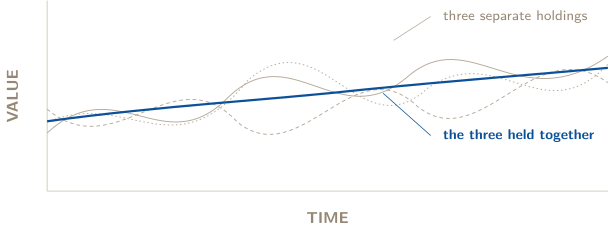
Here is the mechanism in one sentence, which the framework leaves implicit: when holdings do not move perfectly together, losses in one can be partly offset by different movement elsewhere. Against a concentrated risky holding, that can reduce company-specific concentration risk. It does not guarantee a steadier path than every component, eliminate exposure to any company that remains in the portfolio, remove market-wide risk, or promise a return.
PROBLEM 1
Build compound interest; do not borrow it
Two accounts open on the same day with $2,000 each, both paying 6% per year. Account S credits simple interest: 6% of the original deposit, every year. Account C compounds annually: 6% of whatever is in the account at the time. (a) Work out both balances for years 1, 2 and 3, one year at a time, showing the interest credited each year. (b) From that pattern, write the balance after years for each account. (c) How long does Account C take to double, and does the Rule of 72 agree? (d) Compare the two at 10, 30 and 40 years, and say in plain terms where the difference comes from.
BEFORE YOU COMPUTE
Do not reach for a formula. The whole point of part (a) is that the formula in part (b) should fall out of the arithmetic you just did, and if you write it down first you will never see where the exponent comes from.
Before computing, name the four inputs from the toolbox: , per year, in years, compounding once a year in C and not at all in S. Everything below is those four numbers arranged two ways.
WORKING
(a) One year at a time.
Year 1. Both accounts hold $2,000 and earn . Both balances are $2,120.00. The accounts are identical after one year — there is nothing for compounding to compound yet.
Year 2. Here they split, and the split is the entire subject.
Account S computes interest on the original $2,000 again: another $120.00, balance $2,240.00.
Account C computes interest on what is actually in the account, which is now $2,120.00:
The extra $7.20 is $120 0.06 — it is the interest on year one’s interest. That is the only thing compounding ever does. Everything spectacular that follows is this $7.20 happening again and again to a bigger number.
Year 3. S: another $120.00, balance $2,360.00. C: , balance $2,382.03. The gap is now $22.03.
(b) Generalize from the pattern, don’t guess it.
For S, the interest is $120 every year, forever — it never changes, because the base never changes. After years:
That is a straight line: same slope every year.
For C, look at what each year actually did. Each year multiplied the balance by — adding 6% to something is the same as multiplying it by , which is worth pausing on, because it is the step that turns addition into exponentiation:
The exponent is not decoration. It is a count of how many times you pressed . That reading matters practically: on a four-function calculator, is five keystrokes, and knowing that is the difference between being stuck and being slow.
(c) Doubling. The Rule of 72 says years. Check it by pressing twelve times from $2,000:
That is a double, slightly early — the exact doubling time is 11.9 years, so the rule overstates by about a month. Good enough to reason with, not exact, and it is an arithmetic convenience rather than anything the course framework asserts.
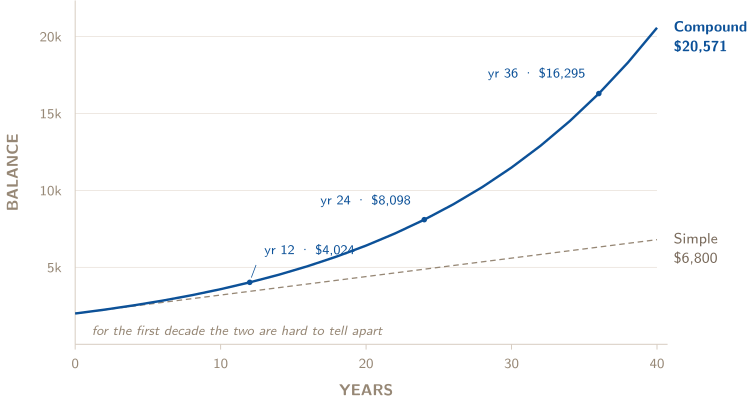
The reason to carry it is that doubling times let you check a compound answer without a calculator. Twelve years to double at 6% means $2,000 should be about $4,000 at year 12, $8,000 at 24 and $16,000 at 36. The true values are $4,024, $8,098 and $16,295. If your calculator ever tells you $6,000 at year 36, you now know instantly that it is wrong.
(d) The comparison, and where the gap comes from.
| After | Simple (S) | Compound (C) | Gap |
|---|---|---|---|
| 1 year | $2,120.00 | $2,120.00 | $0.00 |
| 2 years | $2,240.00 | $2,247.20 | $7.20 |
| 3 years | $2,360.00 | $2,382.03 | $22.03 |
| 10 years | $3,200.00 | $3,581.70 | $381.70 |
| 30 years | $5,600.00 | $11,486.98 | $5,886.98 |
| 40 years | $6,800.00 | $20,571.44 | $13,771.44 |
Read that table left to right and then top to bottom, because the shape is the lesson. After one year the accounts are identical. After three years the gap is $22 — an amount nobody would change a decision over. After forty it is $13,771, which is nearly seven times the original deposit.
Where the money comes from. Account S earns interest on $2,000 forty times: , and that is all it can ever earn. Account C earns interest on $2,000 too, and additionally on every dollar of interest it has already paid you. By year 40 the account holds $20,571, of which only $2,000 was ever yours to deposit — the other $18,571 is interest, and most of that is interest on interest.
And the shape is the practical point. Look at Figure 6: the two lines are indistinguishable for the first decade. That is why this is hard to believe when you are eighteen and easy to believe when you are fifty, and why it is the one idea in personal finance that genuinely rewards being told early. The curve does not reward patience out of fairness. It rewards patience because the last few doublings are the only large ones, and you only reach them by having started.
ANSWER
(a) Year 2 is where they separate: S pays $120.00 again; C pays $127.20, because it also pays 6% on year one’s $120 of interest. (b) ; . (c) Rule of 72 gives 12 years; $2,000, so the rule is right to within about a month. (d) At 40 years, $6,800 versus $20,571.44, a gap of $13,771.44: S can only ever earn interest on the original $2,000, while C earns interest on all the interest as well.
WATCH OUT
The error that produces a plausible wrong answer. Computing compound interest as — $2,000 of interest — and calling it compounding. That is the simple answer, it is $13,771 low, and nothing about it looks wrong on the page. If your compound figure and your simple figure are close for a long horizon, you have computed the same thing twice.
And the rounding trap, since this problem invites it. If you round the balance to the nearest dollar each year and carry that forward, forty years of compounding lands on $20,579 instead of $20,571.44 — $7.56 of pure bookkeeping error, because each year’s rounding gets compounded along with everything else. Notice that it landed above the true figure. The sign depends on which way the individual years happened to round, so this is not an error you can correct for afterwards; the only fix is not to make it. Carry every decimal and round once at the end. (Rounding to the cent each year costs you a penny over the same forty years, which is why banks can do it and you should not.)
ABOUT THIS EXCERPT
This is the opening of a 61-page guide: the diagnostic tree, the full Master Toolbox, and the first worked problem. 8 more problems follow in the complete guide, each worked the same way — what to notice before you start, every step shown, and the mistake that problem invites. The complete guide is shared with families during the fit conversation.
Engineering Confidence — engineeringconfidence.one
Source and review notes
What this resource is
Complete browser edition of the public excerpt from an original Engineering Confidence packet aligned to the AP Business with Personal Finance framework effective Fall 2026. Every household and business scenario is fictional; this is educational material, not investment advice.
- Published
- Last reviewed
- Printable edition
- 24 pages
Course reference: official College Board course page.
Read the complete packet above in the browser, or use the PDF for its fixed-page print layout and offline reading.
Download the 24-page PDF excerpt