
Read the public excerpt
The same instruction and worked examples appear here and in the printable PDF excerpt. You can request full guides for upcoming units below.
READ THIS FIRST
About this guide. Macroeconomics gets taught as vocabulary and tested as measurement. That gap is where correct definitions turn into wrong calculations.
Almost every question in this unit is really the same question wearing a different costume: how much of this change is real, and how much of it is just the ruler moving? A country’s output rises 37% in three years — but if prices rose 21% over the same stretch, most of that “growth” is the measuring stick shrinking, not the economy growing. A salary rises 18.75% — but if the cost of living rose 22.97%, the raise was a pay cut. An unemployment rate falls — but if it fell because people stopped looking for work, the labor market got worse, not better.
Each of those is a two-line calculation. Each of them, done carelessly, produces a confident number pointing the wrong direction. The vocabulary is real and you need it, but the vocabulary is not the test.
One thing about this exam in particular. You are allowed a four-function calculator — a handheld one, or the four-function calculator built into Bluebook — and you are given no formula sheet. Every formula in this unit — the expenditure identity, the price index, the unemployment rate, the deflator — has to come out of your head. That is why the Master Toolbox in this guide is written to be memorized rather than skimmed, and why every worked solution below writes the formula out before substituting into it. That habit is not decoration: the exam’s own free-response prompts say calculate each of the following and show your work, so the formula and the substitution are part of what you were asked to produce, not optional scaffolding around the number.
Numbers here are carried at full precision and rounded once, at the end. Where rounding early would change the printed answer, the solution says so and shows you both.
Every topic in the unit, and where it lives. The College Board lists seven; here is each one and the page that teaches it.
- 2.1 the circular flow and GDP — cards 1, 2 and 3 (p. 15); Problems 1, 2 and 9.
- 2.2 what GDP leaves out — card 1’s fifth gate; Problem 1(c).
- 2.3 unemployment: the rate, the participation rate, the three kinds and the natural rate — cards 7 and 8 (p. 24); Problems 7 and 8.
- 2.4 price indices and inflation — cards 4 and 5 (p. 19); Problems 3 and 5.
- 2.5 what inflation costs, and whom — card 6 (p. 22); Problem 6.
- 2.6 real against nominal GDP, and the deflator — card 5 (p. 20); Problems 4 and 9.
- 2.7 the business cycle and the output gap — card 9 (p. 27); Problem 8.
WHERE THE POINTS GO ON THIS UNIT
On one 2025 free-response question, 70% of students drew the Phillips curve correctly and, on the very next part of the same question, 32% computed an unemployment rate. They had the relationship; they did not have the measurement. The College Board says why in this unit’s own exam note: “quantitative analysis in economics involves interpretation and application, which is more cognitively demanding than just carrying out a simple calculation,” and a student who has memorized a formula without the concept “may struggle to carry out the appropriate calculations or analysis of given data in different contexts on the AP Exam.” In 2026, 66% of the cohort earned a 3 or higher and the bands were unusually even — no score is a safe assumption on this exam.
Draw it and run it. Every diagram in this course has a number attached — the unemployment rate the Phillips curve plots, the real GDP the aggregate demand and supply diagram measures — and the exam asks for the number in the part after the picture. Practice the picture and its arithmetic in the same breath: a rate needs a numerator, a denominator, and a boundary saying who is inside each.
The formula is part of the answer. There is no formula sheet, and the prompts say calculate and show your work. Write the formula, then the substitution, then the number: the unemployment rate as , then , then . A bare number earns the number’s point and nothing for the method the question was testing.
Name the denominator. The population is not the labor force; last year’s index is not 100; the earlier value, not the later one, sits under a growth rate. Every classic loss in this unit is a denominator that moved, and the guard is to write the denominator’s name before you divide.
Percent is not percentage points, and a sign is a claim. A rate that goes from 5% to 7% rose two percentage points, or 40 percent, and the words have to match the arithmetic. “Real income changed by 3.43%” is half an answer; fell, so purchasing power declined, is the other half.
Diagnostic Decision Tree
HOW TO READ A MACRO PROMPT
Run these questions in order, before touching a formula. Each one eliminates whole families of tools, which is what stops you computing something correct and irrelevant.
1. Am I being asked about a quantity or about a price level? This is the fork the whole unit hangs on. Quantities are amounts of stuff: output, employment, the number of people looking for work. Price levels are indices: CPI, the GDP deflator. They are different kinds of number and they take different tools. GDP is a quantity question. “How much did the cost of living rise” is a price level question. “Did output actually grow” is both, in that order — you need the price level to strip it out of the quantity.
2. If it is a quantity: is it measured at this year’s prices or at some base year’s prices? At this year’s prices it is nominal. At a fixed base year’s prices it is real. Two consequences follow immediately and both are examinable. Nominal figures mix two things — how much was produced and what it cost — so a change in a nominal figure never tells you by itself whether anything was actually produced. Real figures hold prices still on purpose, so a change in a real figure is a change in production. When a prompt says “adjusted for inflation,” “in constant dollars,” “in 2019 dollars,” or “real,” it is telling you the price effect has already been removed.
3. Am I asked for a level or for a change? A level is a standing figure: GDP is $1,210 billion; the CPI is 114.7. A change is a rate: output grew 13.8%; inflation was 6.4%. A common failure is reporting the wrong species of number — “the inflation rate is 114.7” is a level answering a change question, and it is wrong by a category, not by arithmetic. The tell is in the prompt’s verb: calculate the index wants a level, calculate the rate of inflation wants a change.
4. If it is a rate: what exactly is the denominator? Every rate in this unit is defined by its denominator, and every classic trap in this unit is a denominator that moved while you weren’t looking.
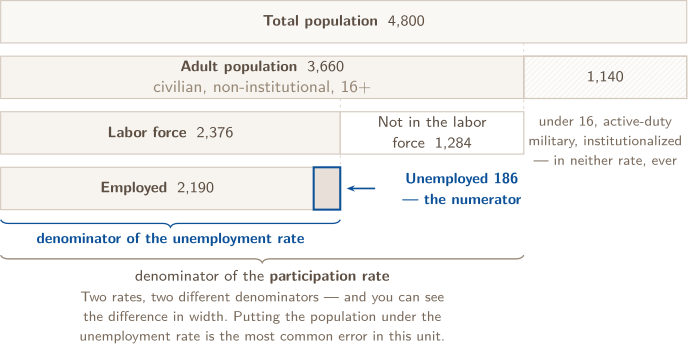
- Unemployment rate — divided by the labor force, not the population. People who stop looking for work leave the denominator, which can push the rate down while the labor market deteriorates. Problem 7 is that trap, worked in full.
- Labor force participation rate — divided by the adult population, a much larger number.
- Inflation rate — divided by last period’s index, never by the base year’s 100. Dividing by 100 out of habit is the classic slip on index questions.
- Growth rate of anything — divided by the earlier value.
5. Is one of my numbers an index? An index has no units. It is a ratio scaled by 100, and the only sensible things to do with it are divide one by another or take a percentage change. You cannot add two indices, average them meaningfully, or attach dollars to one. If your work has an index being added to a dollar figure, stop — the error is upstream of the arithmetic.
6. Does my answer’s direction make sense, and did I say it? Every answer in this unit has a sign, and the sign is a separate claim from the magnitude. “Real income changed by 3.43%” is not an answer; “real income fell by 3.43%, so purchasing power declined” is. The direction completes the economic interpretation, and it is the part students most often leave off when they are rushing.
Where to Look When You’re Stuck
HOW TO USE THIS MAP
The tree above is for a problem you are about to start. This table is for one you are already inside. Find your sentence, do the move in the middle column, then turn to the card or problem on the right. The Master Toolbox is a reference, not assigned reading.
GDP, PRICES, AND REAL VALUES
What is happening | First move | Where |
|---|---|---|
“I cannot tell whether the transaction counts” | Separate production from a transfer of ownership, then check the production boundary and the period. | p. 15, Prob. 1 |
“I keep counting the same output twice” | Use either the final sale or each firm’s value added, never every sale price. | p. 16, Prob. 2 |
“I do not know which GDP component gets it” | Name the buyer and what was purchased before touching the expenditure identity. | p. 17, Prob. 1 |
“I have an index, but the question asks for inflation” | An index is a level. Inflation is the percentage change between two levels, over the earlier one. | p. 19, Prob. 3 |
“Nominal and real are moving differently” | Keep the measured year’s quantities and hold the price ruler fixed. Label the base year beside every real figure. | p. 20, Prob. 4–5 |
INFLATION SURPRISES, LABOR, AND THE CYCLE
What is happening | First move | Where |
|---|---|---|
“Changing the base year changes my growth answer” | That is the fixed-base limitation, not an arithmetic failure. Compare the weights each base year assigns. | p. 20, Prob. 4, 9 |
“Inflation surprised a lender and borrower” | Keep the nominal contract fixed; compare actual with expected inflation, then name both ends of the transfer. | p. 22, Prob. 6 |
“I cannot choose the labor-market denominator” | Classify people first. Unemployment uses the labor force; participation uses the civilian noninstitutional population. | p. 24, Prob. 7 |
“Frictional, structural, or cyclical?” | Ask what must change: time, the worker’s match, or economy-wide demand. | p. 26, Prob. 8 |
“I found the largest output and called it a peak” | A turning point is a change of direction. Then compare actual with potential for the gap. | p. 27, Prob. 8 |
“Output passed its old peak, but the gap is still negative” | Name the benchmark before answering “recovered”: prior actual peak or current potential output. | p. 27, Prob. 8 |
If none of those is your sentence, the final section of this guide is the longer version. It is organized by what went wrong, not by the vocabulary term you were supposed to remember.
Master Toolbox
The nine cards below are independent reference tools. Start with the one the map named; no card assumes you read the one before it.
1. GROSS DOMESTIC PRODUCT: THE DEFINITION AND ITS BOUNDARY
GDP is the market value of all final goods and services produced within a country’s borders during a given period. Every word in that sentence is doing work. The first four gates below come directly from it. The fifth is a measurement boundary: national accounts include marketed output, government and nonprofit services valued by their production cost, and specified imputations such as the housing service homeowners provide to themselves. They exclude many household services for which the accounts do not construct a value. A literal sale is common; it is not a universal requirement.
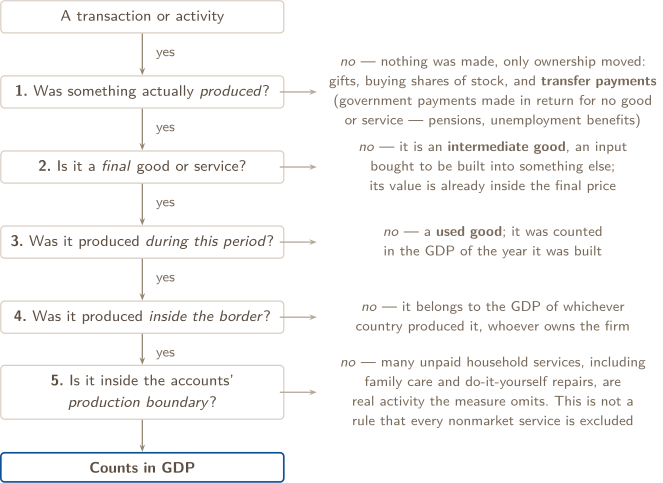
Tests 1–4 sort the ordinary AP cases. Gate 5 is different in kind: an activity can be genuinely productive and still sit outside the chosen boundary. Unpaid family childcare is the case in Problem 1(c). But do not turn that example into “no sale, no GDP.” Public-school instruction and other government output are included even without a market sale, and the accounts impute values for a small set of services where no cash changes hands. The boundary is a limitation, not a claim that omitted work has no value.
The trap inside test 1. When ownership of an existing asset moves, the asset itself does not count — but any service someone performed to arrange the transfer does, because that service was produced this year. The used house does not count; the real estate agent’s fee does. The shares do not count; the broker’s commission does. This catches almost everyone the first time. One national-accounts detail matters in Problem 1: a household’s securities-broker service is consumption, while a residential broker’s ownership-transfer service is recorded with residential fixed investment.
2. THE CIRCULAR FLOW: WHY SPENDING EQUALS INCOME
GDP can be measured three different ways — by adding up what was spent, by adding up what was earned, or by adding up the value added at each stage of production — and all three land on the same number. That is not a coincidence to be memorized. It follows from the shape of the economy.
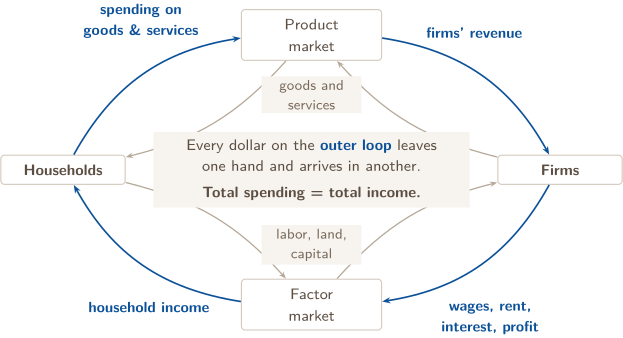
The two markets are where the exchanges happen. In the product market, firms sell finished goods and services to households. In the factor market, households sell the resources they own — their labor, land, and capital — to firms.
The outer loop is money; the inner loop, running the other way, is the real stuff the money pays for. The loop is closed, so the same flow measured at any point gives the same total: one person’s spending is another person’s income, which is why the expenditure approach and the income approach cannot disagree.
The third route cuts the same identity a third way. A firm’s value added is what its own work contributed — what it sold its output for, minus what it paid other firms for the inputs it built into that output:
Summing value added across every firm counts each firm’s contribution exactly once, and lands on the same total as counting final sales. Problem 2 proves that arithmetically rather than asserting it.
3. THE EXPENDITURE IDENTITY
Write it out before you substitute, every time. Four buckets, and the whole difficulty is sorting items into them.
- — consumption. Household spending on goods and services: food, rent, haircuts, a car. Not new houses — those are investment. A securities broker’s service purchased by a household is a current financial service and belongs here.
-
— gross private domestic investment. Firms buying capital: machinery, tools, factories, software. Plus two items students routinely misfile:
- New residential construction — a newly built house counts as , not , however ordinary the buyer. National accounts also place brokers’ commissions and other ownership-transfer costs on residential property in residential fixed investment, including when the underlying house is not new.
- The change in inventories — output produced this year but not yet sold. The firm is treated as having bought its own unsold output. This keeps GDP a measure of production rather than of sales, and it is why the change can be negative: a year spent selling down the warehouse subtracts.
“Investment” here never means buying financial assets. Shares and bonds are not in ; they are not in GDP at all.
- — government purchases of goods and services at every level: roads, salaries of public employees, defense equipment. Not transfer payments — pensions, unemployment benefits, subsidies. Money moves; nothing is produced. (When the recipient later spends it, that spending shows up in , where it belongs.)
- — net exports. Exports minus imports.
Why imports are subtracted, since this is the component students get backwards. It is not a claim that buying from abroad shrinks the economy. It is a correction. The , , and figures are collected as total spending, and that total already includes spending on imported goods — which were not produced here. Subtracting removes what was double-counted in, so that what is left is domestic production. Problem 1(b) follows a single imported purchase all the way through.
A check first. One question opens three of the cards and problems below and is answered where that piece ends. Answer it before you read on. Getting it wrong is the point — that is what makes it stick.
1. CHOOSE THE PRICE INDEX
The price of an imported household appliance rises. Could that affect the CPI without directly entering the domestic GDP deflator?
4. THE CPI, AND THE FOUR WORDS FOR WHAT PRICES DO
The consumer price index (CPI) prices a fixed market basket of consumer goods and services in one year relative to a chosen base year. It is intended to measure the income change a consumer would need to maintain the same standard of living as the price level changes.
The base year’s index is 100 by construction — if you compute it and get anything else, you made an arithmetic error, not a discovery.
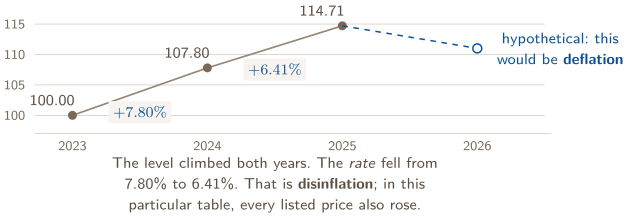
Reading an index aloud. means the basket costs 14.71% more than in the base year. It does not mean prices are 114.71% higher, and it does not mean anything at all about one specific product. Practice saying the sentence; free-response questions ask for it.
The inflation rate is the percentage change in the index, and its denominator is the earlier index — not 100, unless the earlier year happens to be the base year:
Four words describe four different things, and three of them get confused:
- Inflation — the price level is rising. The index goes up. The rate is positive.
- Disinflation — the price level is still rising, but more slowly than before. The index still goes up; the rate is still positive, just smaller. The overall basket got more expensive; individual prices inside it may still fall.
- Deflation — the price level is falling. The index goes down. The rate is negative. This is a different event from disinflation and it is not a milder version of it.
- Real — any variable with the price effect removed. See toolbox 5.
Substitution bias. The basket is held fixed on purpose — that is what makes the comparison honest about prices rather than about changing tastes. But it means the index assumes households keep buying the same quantities even when one item’s price runs away. In reality they buy less of it and more of the cheaper substitute, so their true cost of living rises by less than the fixed basket implies. When that substitution occurs, a fixed-basket CPI overstates the increase needed to maintain the same standard of living. Note the direction.
5. REAL VS. NOMINAL — THE SPINE OF THIS UNIT
Nominal means measured at the prices actually prevailing at the time. Real means the price effect has been removed. This packet first does that with the AP classroom’s fixed-base method: value each year’s output at one base year’s prices. Converting nominal to real is called deflating.
The mechanism, in one sentence. A nominal figure is contaminated by two things moving at once — how much was produced and what it cost. Deflating divides the price movement out, so what is left moved only because production moved.
Two forms, same operation. Use whichever matches the numbers you were handed:
The second form is the useful one when you are asked to put two salaries, or two prices, “in the same year’s dollars.” Notice that it works in either direction, and that both directions give the same percentage change — Problem 5 does it both ways to prove that.
Deflator or CPI? They answer different questions and the exam distinguishes them.
If a question is about households’ purchasing power, reach for the CPI. If it is about converting the nation’s output to real terms, reach for the deflator. The imported phone is the tell: it raises the CPI and never touches the deflator.
In the base year, real equals nominal. By construction: you are valuing base-year output at base-year prices. The index is 100 and dividing by 1 changes nothing. If your real and nominal figures agree in the base year, that is a successful check, not a mistake.
The fixed-base limitation. Holding one year’s prices still is one way to isolate quantities, not the only way national statistical agencies measure real growth. Relative prices change, and households and firms tend to shift toward goods that became relatively cheaper. An old base year’s prices can then put too much weight on the goods whose quantities expanded and too little on the goods whose quantities contracted, so a fixed-base calculation can overstate real GDP growth. Agencies use methods that update the weights over time. The AP task is to know that limitation and its direction; Problem 9 makes two fixed bases disagree without asking you to construct an agency’s chain-type measure.
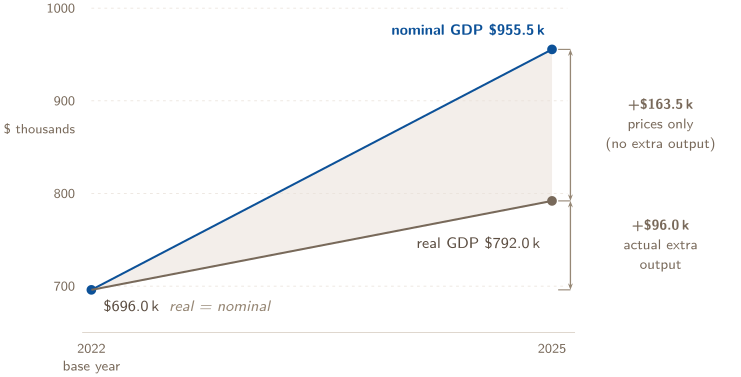
Problem 4 computes every figure on that diagram.
Extension: why growth rates do not quite add. Nominal growth is not real growth plus inflation. Exactly,
so . Subtracting is a good approximation when both rates are small, and it drifts as they grow — the leftover is that cross term. Problem 4 measures the drift at 2.85 percentage points and Problem 5 measures it at 0.79. Use the subtraction for a sanity check; use the division when the question wants a number.
CHECK 1 — CHOOSE THE PRICE INDEX
Yes. The CPI prices what households buy, wherever it was made, so an imported appliance sitting in the basket raises it. The deflator prices what the nation produced, so an import never enters it directly. The two indices answer different questions, which is why purchasing power and real output can move differently in the same year.
6. WHAT INFLATION COSTS, AND WHO PAYS IT
This unit focuses on the AP-required redistribution channel: inflation is especially consequential when it is unexpected and a contract fixes a nominal amount years in advance. A thought experiment in which every price and every income changes together removes that redistribution; it does not prove surprise is inflation’s only possible cost. Even anticipated inflation can consume time and resources through price changes, cash management, tax interactions, and noisier dollar comparisons. The mechanism below is the one this unit asks you to trace, not an exhaustive theory of inflation.
The mechanism. A loan, a wage agreement, a pension: each fixes a number of dollars to be paid in the future. Inflation does not alter that number. It alters what the number buys. So when inflation comes in higher than the two parties expected when they signed:
- The party receiving the fixed payment gets dollars that buy less than planned — lenders lose.
- The party making the fixed payment discharges the same obligation with cheaper dollars — borrowers gain.
Unexpectedly low inflation, or deflation, runs the transfer the other way: from borrowers to lenders. That is why deflation is particularly hard on anyone carrying debt.
Unexpected inflation redistributes purchasing power from lenders to borrowers. A complete explanation names both parties and states why the fixed nominal repayment has lower purchasing power than expected.
Why “unexpected” is the load-bearing word. The transfer turns on inflation differing from a fixed nominal contract’s forecast, not on inflation being high. Expected inflation can be priced into the nominal rate; the forecast error is what moves purchasing power. Problem 6 measures both directions in dollars.
The same logic reaches beyond loans. Anyone holding a claim fixed in nominal terms — a pension with no cost-of-living adjustment, a multi-year fixed wage, cash itself — loses when inflation surprises upward. Anyone owing a fixed nominal amount gains. Contracts that are indexed to the CPI are insulated, which is precisely why indexation clauses exist.
2. INSPECT THE DENOMINATOR
A jobless person has not searched for work in the past four weeks and is not on temporary layoff expecting recall. Can the unemployment rate fall even though nobody was hired?
7. THE LABOR FORCE: WHO IS IN THE DENOMINATOR
Every unemployment question is decided by which box a person is in. Three statuses, and the boundaries between them are where the points live.
- Employed — did any work for pay or profit in the survey week; worked at least 15 unpaid hours in a family business; or had a job but was temporarily absent from it. Part-time counts as employed. Someone working ten hours a week who wants forty is employed, fully, with no asterisk in the official rate.
- Unemployed — no job, available to work, and actively searched during the previous four weeks. There is one official exception: someone on temporary layoff who expects recall is counted as unemployed without an active search.
- Not in the labor force — everyone else in the adult population: retirees, full-time students not seeking work, full-time carers, and discouraged workers — people who want a job but have stopped searching because they believe none is available. A discouraged worker fails the search condition and is therefore not counted as unemployed.
The boundary that matters is between “Unemployed” and “Not in the labor force,” because a person crossing it changes the numerator and the denominator at the same time, in the same direction. That is what makes the unemployment rate capable of improving while the labor market worsens. Problem 7 works the full contrast.
CHECK 2 — INSPECT THE DENOMINATOR
Yes. Someone who has not searched in four weeks and is not on temporary layoff is not in the labor force at all, so leaving “unemployed” takes them out of the numerator and the denominator in the same instant. The rate falls with nobody hired. That is why the participation rate is read beside it and never instead of it.
8. THREE KINDS OF UNEMPLOYMENT, AND THE NATURAL RATE
The categories are defined by cause, not by how long the person has been out of work and not by how they feel about it. Ask what would have to change for this person to be working:
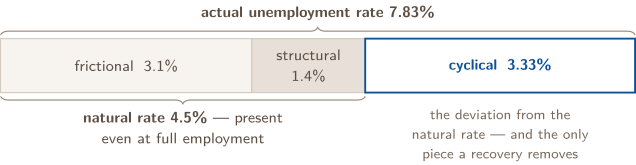
- Frictional — between jobs, searching, relocating, or newly entering the workforce. A healthy economy has this permanently, and some of it is productive: a good match found in six weeks beats a bad one taken in one.
- Structural — a lasting mismatch between the skills or locations workers have and the ones employers need: automation retiring a job category, an industry leaving a region, a credential the worker does not hold. Retraining or moving changes the outcome; waiting does not.
- Cyclical — caused by a downturn in the economy as a whole. It rises in recessions and falls in expansions, and it is the only one of the three that a recovery fixes on its own.
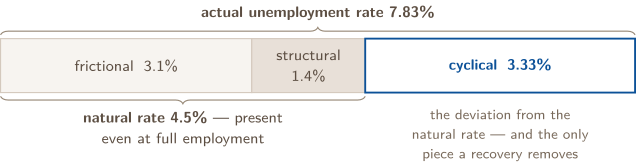
“Full employment” does not mean zero unemployment. It means cyclical unemployment is zero and the actual rate has settled at the natural rate. Frictional and structural unemployment remain, because people will always be between jobs and industries will always be changing. A country reporting 0% unemployment would be reporting a broken statistic, not a triumph.
The natural rate itself drifts over decades as the workforce changes — its age mix, how easily job-seekers and employers find each other, how fast technology retires occupations. It is not a constant of nature and the exam does not expect you to treat it as one.
9. THE BUSINESS CYCLE AND THE OUTPUT GAP
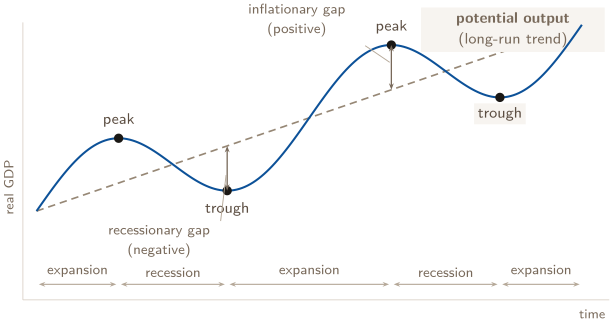
Business cycles are fluctuations in aggregate output and employment caused by changes in aggregate demand and/or aggregate supply. Real output does not grow smoothly; it moves around a long-run path, and the vocabulary for those movements is precise.
- Phases: expansion and recession. Expansion — output and employment rising. Recession — output and employment falling.
- Turning points: peak and trough. The peak is the last period of an expansion, where output stops rising and starts to fall. The trough is the bottom, where a recession ends and expansion begins.
- Potential output (also called full-employment output) is what the economy can produce when unemployment sits at the natural rate. It often follows a rising long-run trend, including through a demand-driven recession, but it is not guaranteed to rise every period. Changes in labor, capital, productivity, or supply conditions can change its level or growth rate.
- Output gap actual output potential output. Negative (a recessionary gap): unemployment is above its natural rate and cyclical unemployment is positive. Positive (an inflationary gap): unemployment is below its natural rate and the economy is running beyond its sustainable rate.
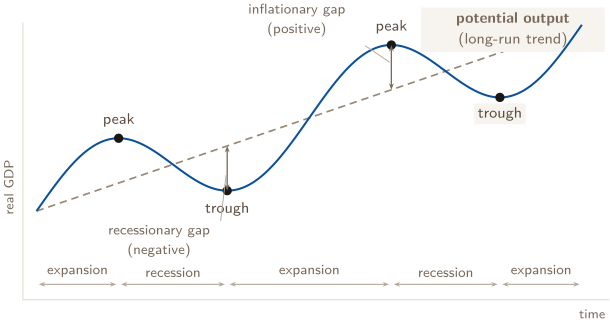
One thing the picture makes obvious that a sentence does not: the second peak is higher than the first — a peak is a turning point, not a record. Problem 8 reads all of this off a data table.
PROBLEM 1
What counts in GDP, and what is deliberately left out
The table below lists everything recorded by the statistical agency of Marisol, a fictional country, during 2025. All figures are in billions of dollars.
Recorded during 2025 | $ bn |
|---|---|
Household purchases of food, clothing, and services | 612 |
Newly built homes sold to families | 143 |
Firms’ purchases of new machinery and equipment | 188 |
Increase in firms’ unsold inventories over the year | 17 |
Government purchases of goods and services (all levels) | 296 |
Government transfer payments (pensions, unemployment benefits) | 174 |
Exports of goods and services | 155 |
Imports of goods and services | 209 |
Steel sold by Marisol’s mills to Marisol’s car factories | 66 |
Sales of previously built houses | 88 |
Household purchases of shares in Marisol’s companies | 54 |
Brokers’ commissions on those share purchases | 3 |
Real estate agents’ fees on those previously built houses | 5 |
Estimated value of unpaid childcare provided within families | 121 |
(a) Compute Marisol’s 2025 GDP by the expenditure approach, naming the component each included item belongs to and the reason each excluded item is excluded. (b) Explain why imports are subtracted, to someone who thinks it means trade makes a country poorer. (c) Suppose every family in Marisol decided to hire paid childcare next year instead of providing it themselves. Suppose the same services are purchased for $121 billion and all other production is unchanged. What happens to measured GDP, and what does that tell you about GDP as a measure of well-being?
BEFORE YOU COMPUTE
Do not start adding. Fourteen items are on that list and five of them are traps; if you begin arithmetic before sorting, you will add a trap without noticing.
Sort first. Take each line down the definition and production-boundary gates in toolbox 1 and write the verdict beside it — , , , , , not separately added, or excluded, because …. The reason matters as much as the verdict: “excluded” does not distinguish a transfer from a used asset or omitted household production, while one clause does.
Two pairs on this list are the ones almost everyone gets wrong. Watch what happens to the shares and the securities-broker service, then to the old houses and the residential ownership-transfer service. Each asset stays out; each newly produced service counts, but the two services do not enter the same component.
WORKING
(a) Sort every line first, then add.
Item | $ bn | Verdict |
|---|---|---|
Household food, clothing, services | 612 | |
Newly built homes | 143 | — residential construction is investment, not consumption |
New machinery and equipment | 188 | |
Increase in unsold inventories | 17 | — produced this year, not yet sold |
Government purchases | 296 | |
Transfer payments | 174 | excluded — fails test 1: money moved, nothing was produced |
Exports | 155 | |
Imports | 209 | subtracted as |
Steel sold to car factories | 66 | not separately added — intermediate input, already inside the price of the cars |
Previously built houses | 88 | excluded — fails test 3: counted in the GDP of the year each was built |
Share purchases | 54 | excluded — fails test 1: ownership of an existing asset changed hands |
Brokers’ commissions | 3 | — the service of arranging the trade was produced in 2025 |
Real estate agents’ fees | 5 | — residential ownership-transfer services are recorded with residential fixed investment |
Unpaid childcare | 121 | excluded — household service outside the accounts’ production boundary |
Now assemble each component, and keep the units attached the whole way:
billion. The securities-broker service is household consumption; the shares themselves do not appear.
billion. The residential broker fee is an ownership-transfer cost recorded with residential fixed investment; the previously built house itself is not current production.
billion — purchases only. The 174 of transfers stays out.
billion. Negative is a normal result, not an error signal; it means Marisol imported more than it exported.
Substitute into the identity, written out first:
(b) The subtraction is bookkeeping, not a judgment about trade.
Here is the mechanism. The agency does not go and count factories; it collects spending. So the 612 of household purchases is total household spending — on domestic goods and on imported goods mixed together, because a shopper’s receipt does not say where the item was made. The same is true of and . By the time you have added , every imported good in the country has been counted once, in whichever bucket the buyer sat in.
But GDP is supposed to measure production inside Marisol’s borders, and imports were produced elsewhere. So they have to come back out. Subtracting removes exactly what got swept in.
Follow one transaction all the way through to see it close. A household buys a laptop made abroad for $900:
- rises by 900 — the household spent 900.
- rises by 900 — Marisol imported 900.
- Net effect on GDP: .
Zero is the right answer, because no Marisolan production occurred. If imports were not subtracted, GDP would rise by 900 on the strength of a laptop nobody in Marisol built. The subtraction protects the definition; it does not punish trade.
(c) Measured GDP would rise by the full 121 billion, from 1,210 to 1,331 billion — an increase of
and not one additional hour of childcare would have been provided. The same work, done by the same kind of person, for the same children — but now with a price attached, so the measure can finally see it.
GDP did not mismeasure a little. It moved 10% on a change in who was paid, not in the childcare provided. Many household services — care for relatives and do-it-yourself repairs, for example — sit outside the production boundary and are invisible in exactly this way. That is not a claim that every nonmarket service is omitted: government production and specified imputations are included. Two countries with similar living standards can still report different GDPs if one routes more household work through measured transactions.
GDP is a measure of production inside a defined accounting boundary. It was never a complete measure of well-being, and this example states the missing piece rather than leaving that limitation as a slogan.
ANSWER
(a) GDP
billion, from ,
,
,
.
Transfer payments, used houses, share purchases, and unpaid childcare
total $437 billion outside this GDP calculation. The $66 billion of steel is
not separately added: its value is already embodied in the final cars.
(b) ,
,
and
are collected as total spending and therefore already contain spending
on imports, which were not produced domestically. Subtracting
removes them, so GDP measures domestic
production. A $900 imported laptop raises
by 900 and
by 900: net effect zero.
(c) Measured GDP rises by $121 billion to $1,331 billion, a 10.0%
increase, with no change in the childcare actually provided.
Many unpaid household services sit outside the production boundary, so
moving this work into a measured transaction raises GDP without raising
the childcare supplied — one reason GDP is not a complete measure of
well-being.
WATCH OUT
Transfer payments swept into . This is the single most common error on this problem. Transfers are government outlays, they appear in the government’s budget, and it feels natural to add them. Doing so gives and billion — an answer that is wrong by 174 because it treats a transfer of income as newly produced output.
The test is test 1: was anything produced? A pension payment produces nothing at the moment it is made. It is income moving from taxpayers to a retiree. When the retiree spends it on groceries, that purchase is production being bought, and it enters GDP through — once, at the right moment. Counting the transfer as well would count the same activity twice.
The other two near-misses. Adding the intermediate steel gives $1,276 billion — double-counting, because the steel’s value is already inside the price of the cars it became. Adding the used houses gives $1,298 billion — those were counted the year they were built, and GDP is a flow per period, not a running total of everything that exists.
CONNECTION
The inventory line looks like a rounding footnote and is not. Counting the 17 billion of unsold output as investment is what makes GDP a measure of production rather than of sales — if it were left out, a country could show falling GDP in a year when its factories ran flat out and merely built up stock. It also means the line can be negative: a year spent selling from the warehouse subtracts from GDP, because those goods were produced in an earlier year. Problem 2 shows the same idea from the other side, following a single shirt that never reaches a customer.
ABOUT THIS EXCERPT
This is the opening of a 60-page guide: the diagnostic tree, the full Master Toolbox, and the first worked problem. 8 more problems follow in the complete guide, each worked the same way — what to notice before you start, every step shown, and the mistake that problem invites. The complete guide is shared with families during the fit conversation.
Engineering Confidence — engineeringconfidence.one
Source and review notes
What this resource is
Complete browser edition of the public excerpt from an original Engineering Confidence AP Macroeconomics packet aligned to the College Board framework effective Fall 2026. All numerical scenarios are fictional and original.
- Published
- Last reviewed
- Printable edition
- 22 pages
Course reference: official College Board course page.
Read this public excerpt above, or save the PDF for printing and offline reading.
Download the 22-page PDF excerpt