Read the public excerpt
The same instruction and worked examples appear here and in the printable PDF excerpt. You can request full guides for upcoming units below.
READ THIS FIRST
About this guide. Unit 1 runs on three connected habits. The counting habit moves among mass, moles, particles, and composition. The evidence habit reads peaks, intensities, and measured masses as representations of atoms and mixtures. The explanation habit uses electron structure, effective nuclear charge, shielding, and distance to account for periodic behavior. Treating those as separate lists creates a memory problem; using them as three views of the same particles creates a system you can check.
On the current AP Chemistry exam, Unit 1 accounts for 7–9% of the multiple-choice questions. The exam is hybrid: the questions appear in the Bluebook application, and you handwrite the free-response work. A scientific or graphing calculator is permitted throughout, and the supplied reference information includes a periodic table and equations/constants. In free-response calculations, the setup still has to remain visible: a calculator result is evidence only when the work says what was calculated.
If you arrive with something already going wrong, use the symptom map or The Stuck Toolkit. Both are organized by the sentence you would say out loud — “my mole ratios look ugly,” “I cannot read this spectrum,” “my trend explanation is circular” — because that is usually easier to recognize than the name of the missing tool.
WHERE THE POINTS GO ON THIS UNIT
Three habits earn most of the credit that Unit 1 questions carry, and the College Board says so in its own course description.
The mechanism, not the ranking. The exam asks you to explain a trend, and the graders report that students who can recite periodicity “struggle to explain the electrostatic interactions” behind it — and its exceptions. A ranking is not an explanation. Name the electron being compared, then the nuclear charge it feels, the shielding between, and the distance; the property follows.
The claim and its evidence, in that order. A free-response part that says justify is scored on whether a piece of evidence — a peak, a configuration, a number of core electrons — to a chemical principle. State the claim, point at the evidence, name the principle. Connect all three; the question’s rubric determines the score.
The number and its units on the same line, to the right number of digits. On the 2025 exam a rate-constant question scored the value and its units as separate points: 64% of students earned the value, 33% earned the units. Carry that habit into every unit. Every quantity in this guide carries its units on the line it is computed on; copy the habit, not just the chemistry.
Diagnostic Decision Tree
TWO PASSES: PACKAGE FIRST, JOB SECOND
These routes overlap on purpose. A formula can lead to a molar mass, composition, particle count, electron count, or ionic formula. First name the representation the prompt handed you; then name the job it asks you to do. Do not stop at an earlier route merely because one of its words also appears.
1. Formula, mass, moles, or particles. If the job is “how many” or “what mass,” mark the start and finish on the mole map. If the job is a mass percent, use the formula to build one mole first.
2. Isotope masses, abundances, or a mass spectrum. Decide whether the vertical information is already a fraction or is only relative intensity. Normalize when needed, then use a weighted average. A location on the mass axis and a peak height answer different questions.
3. Elemental percentages, analysis masses, or a mixture. Formula percent is the forward direction. Percent or element masses formula is the reverse direction. A mixture may use a bridge component. For a binary mixture of known components, one elemental measurement can instead determine the one unknown fraction when the components have different elemental compositions; additional unknowns require additional independent data.
4. A mass before and after a laboratory step. Name what each mass is a mass of . The difference may represent material lost, material gained, or a changed mixture; the procedure and chemical context determine which. Convert named substances to moles before using a formula ratio.
5. Electron configuration or a photoelectron spectrum (PES). A configuration inventories electrons by subshell. A PES peak groups electrons with similar binding energy: peak area or relative intensity tracks how many, while horizontal position tracks how tightly they are held.
6. A ranking, ion, analogous compound, or reactivity comparison. Start with valence structure. For a trend, identify the electron being compared and discuss effective nuclear charge, shielding, and distance. For an ion or ionic compound, use the valence count to predict the usual charge and balance total charge.
Last pass: what form must the response take? Calculate requires the mathematical steps to the final value. Explain requires how or why, supported by evidence or reasoning. For a graph or PES drawing, the requested axes, directions, peaks, and labels belong in the visual rather than only in surrounding prose.
Where to Look When You’re Stuck
SYMPTOM FIRST MOVE WORKED MODEL
What is happening | First move | Where |
|---|---|---|
“I do not know whether to multiply or divide” | Write a units chain; place the unit you hold on the bottom so it cancels. | p. 11, Prob. 1 |
“The spectrum heights do not add to 100” | Add all relative intensities and divide each by that total before weighting. | p. 15, Prob. 2 |
“My formula ratio is close to a fraction” | Separate measurement scatter from a simple fraction; test small whole-number multipliers. | p. 17, Prob. 4, 6 |
“The sample is a mixture and one percent is buried inside another” | Name the measured component and ask whether it belongs to only one mixture component. | p. 18, Prob. 5 |
“I cannot connect a PES peak to a configuration” | Read horizontal position as binding energy and area/intensity as electron count. | p. 21, Prob. 8, 10 |
“My trend explanation only restates the ranking” | Name the electrons compared; then track effective nuclear charge, shielding, and distance. | p. 23, Prob. 9–10 |
“I have a valence count but not an ion or compound” | Predict the usual main-group ion, then require total ionic charge to be zero. | p. 24, Prob. 7, 10 |
“I have a number but no independent check” | Use units, total percent, a forward composition, a peak-count audit, or a trend direction. | Stuck Toolkit |
Master Toolbox — Everything These Problems Use
A check first. One question opens three of the cards below and is answered at that card’s end. Answer it before you read on. Getting it wrong is the point — that is what makes the card stick.
1. COUNT THE NAMED PARTICLE
A sample contains mol of . How many moles of molecules, of carbon atoms, and of oxygen atoms does it contain?
THE ONE IDEA UNDER EVERYTHING: THE MOLE MAP
A mole is a count, exactly the way a dozen is a count. A dozen eggs is 12 eggs; one mole contains exactly specified entities. The current AP reference information rounds the Avogadro constant to ; use the supplied value in AP calculations unless a prompt gives another. The scale of the unit is what connects an atom’s mass in unified atomic mass units to the molar mass in grams per mole. Carbon reads about 12.01 on the table; about 12.01 g of carbon contains one mole of carbon atoms. The periodic table therefore supplies the grams-per-mole conversion for an element. The exam’s reference sheet prints the same fact as one equation,
and every route on the map below that touches mass is that equation run forward or backward.
Which is what makes the periodic table usable as a conversion factor, and that is really all a molar mass is. Many quantitative composition problems in this unit sit on one map, and each is a route across it:
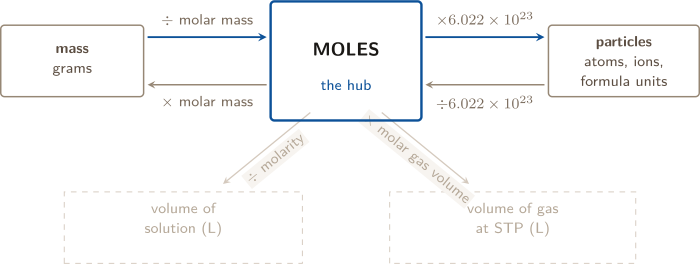
Solid boxes are Unit 1. The dashed boxes are Unit 3 — same hub, two more spokes.
Three things to take off that picture. First, the failure mode: most wrong answers in this topic are attempts to build a route that skips the middle box — a mass multiplied straight by Avogadro’s number, say. If your work never wrote down a number of moles, you went cross-country instead of using the road.
Second, you do not learn eight conversions; you learn two, and read them backwards when you are traveling the other direction. Toward the hub you divide; away from the hub you multiply.
CHECK 1 — COUNT THE NAMED PARTICLE
mol of molecules, mol of carbon atoms and mol of oxygen atoms — mol of atoms altogether. A mole counts whatever entity you name after it, and the formula tells you how many of each atom ride inside one molecule. “0.25 moles” on its own is not an answer, because three different quantities are all 0.25 or 0.50 here; write the entity after the unit every time.
MOLAR MASS: BUILD IT, NEVER RECALL IT
A molar mass is two separate jobs, and the whole trick is doing them separately. Job one: count the atoms. Job two: do the arithmetic. Students who count and multiply in a single motion are the students who find four oxygens in aluminum sulfate.
Job one is where the mistakes live, because of parentheses. A subscript sitting outside a closing parenthesis multiplies everything inside it, and nothing outside it:
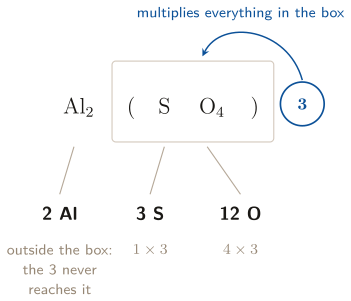
The invisible 1 on the S is the one students forget to multiply.
Now job two, and the discipline is to write one line per element rather than one long sum you cannot check:
| Element | Count | Mass (g/mol) | Subtotal | |
|---|---|---|---|---|
| Al | 2 | 26.98 | 53.96 | |
| S | 3 | 32.06 | 96.18 | |
| O | 12 | 16.00 | 192.00 | |
| 342.14 g/mol | ||||
Use the atomic masses printed on the supplied periodic table and carry guard digits through the calculation. Some values have two decimal places, some do not, and the final precision is set by the measured data rather than by a universal number of table decimals. The subtotals are worth writing down separately even when you could do it in one pass, because percent composition (Toolbox below) needs each of them again — and because a column of numbers can be re-checked, while a single calculator entry cannot.
Rebuild it every time; never quote it from memory. Molar mass is thirty seconds of arithmetic and it is the input to everything downstream — one wrong molar mass silently corrupts the mole count, the percent, the empirical formula, and every answer that depends on them. A later numerical check may not expose that shared setup error. The safest protection is building the molar mass where you can inspect it.
2. CHOOSE THE AVERAGE
A sample is 20% of an isotope of mass 10 u and 80% of an isotope of mass 11 u. Predict which mass the average lies nearer, then calculate it.
MASS SPECTRA OF ELEMENTS
Start with what an isotope is, because the rest is bookkeeping on top of it. Atoms of the same element all carry the same number of protons — that is what makes them that element — but they can carry different numbers of neutrons. Those variants are isotopes. Neutral isotopes of one element have the same electron configuration, so their ordinary chemical behavior is very similar, but isotope mass can affect rates, equilibria, and spectra. They differ in neutron count and mass, not in identity as an element.
A mass spectrometer ionizes particles and separates the resulting ions by mass-to-charge ratio, . In the simplified AP elemental spectra used here, the ions are singly charged monatomic ions, so the horizontal values can be read as isotope masses. Each peak says two things:
- where it sits horizontally — its dimensionless value; because here, that numerical value equals the isotope mass expressed in unified atomic mass units, u (also called amu in some courses);
- how tall it is — how common that isotope is.
Normalize first if the heights are “relative intensity.” A spectrometer usually scales the tallest peak to 100 and reports the rest against it, so the heights are a ratio, not percentages — they will not sum to 100, and using them as though they did is the standard way to get this problem wrong. Divide each height by the total of all heights and you have fractional abundances that do sum to 1.
Then the atomic mass on the periodic table is the weighted average:
Why weighted, and not just averaged. A plain average of the isotope masses would be the right answer only if every isotope in the sum were equally common. Do not assume that. Picture the horizontal axis as a plank and each peak as a weight sitting on it: the weighted average is the point where the plank balances. Put a heavy weight near one end and the balance point slides toward it. That is all “weighted” means, and it gives you a prediction you can make before computing anything.
Two checks. The fractions must sum to 1, and the average must land between the least and greatest isotope masses. For a spectrum with exactly two isotopes, the average lies closer to the more abundant peak (and at the midpoint only when the abundances are equal). With three or more isotopes, the combined pull of all peaks matters, so “nearest the tallest” is not a general rule.
And keep hold of what the number means. No single atom has the average mass. The average describes the mixture; every individual atom in the sample belongs to one isotope. This distinction gets asked directly.
CHECK 2 — CHOOSE THE AVERAGE
Nearer 11, and it is u. The abundances are the weights, so the average is dragged toward whichever isotope is more common — four fifths of this sample is mass 11, so the answer has to sit in the upper part of the range. Predicting the side before computing is the check: an answer of 10.2 would be the same arithmetic with the weights swapped, and the prediction catches it. The midpoint, 10.5, is what you would get only if the two were equally abundant.
PERCENT COMPOSITION, IN BOTH DIRECTIONS
The same relationship gets run two ways, and knowing which way you are traveling is most of the tool selection.
Forward (formula percents). Build exactly one mole of the compound and ask what fraction of its mass each element contributes:
Why one mole? Because any sample size gives the same percentages — percent composition does not depend on how much you have. That is the law of definite proportions: in any pure sample of a compound the mass ratio of its elements is always the same, which is exactly what makes a formula a fixed thing rather than a recipe that varies by batch. So you may as well pick the size whose arithmetic you have already done. The subtotals from the molar-mass table are the numerators; the total is the denominator. No new computation at all.
Reverse (percents formula). Now you want the subscripts, and subscripts are a mole ratio, not a mass ratio.
- 1.
- Assume a 100 g sample. Then every percent becomes a mass in grams with no arithmetic — 78.7% becomes 78.7 g. This is a free move, again because composition does not depend on sample size.
- 2.
- Convert each element’s grams to moles — divide by that element’s atomic mass, not the compound’s.
- 3.
- Divide every mole count by the smallest one. This is the step whose purpose is worth stating: it rescales the ratio so the least-plentiful element comes out as exactly 1, and every other element is expressed as “how many per one of those.” That is what a subscript is.
- 4.
- Clear any fraction to whole numbers. Atoms are not divisible in a formula — there is no such thing as — so a ratio of is not a finished answer. It is the finished answer written at half scale. Multiply both by 2 and you have : the same ratio, now sayable in atoms.
| Nearby simple fraction | Test multiplier |
|---|---|
| .50 | 2 |
| .33 or .67 | 3 |
| .25 or .75 | 4 |
| .20, .40, .60, or .80 | 5 |
Rounding and multiplying are opposite moves, and confusing them is the classic error here. A candidate fraction is supported only when the difference is consistent with the precision or uncertainty of the supplied data. A ratio such as 1.98 may represent 2 when that precision supports the match. A ratio of 1.5 is not a noisy 2; it is a fraction, and fractions get multiplied out rather than rounded off. Test small whole-number multipliers across every ratio, then verify the resulting formula against the measured composition. That procedure catches fifths such as without treating every ugly decimal as a hidden fraction.
One more thing this procedure gives you, and one it does not. What comes out is the empirical formula — the simplest whole-number ratio. Percent composition alone cannot tell from , because both have identical percentages. Prising those two apart takes one extra datum — the compound’s molar mass — and one extra step:
For a molecular substance with consistent molar-mass and composition data, that quotient counts how many empirical units make one molecule and should be near a positive whole number. A result such as 3.4 signals inconsistent or overly rounded data, an arithmetic error, or a model that does not apply to the substance; do not force it to an integer. Once the quotient is supported, multiply every subscript by it, not just the first.
Without that extra datum, empirical is the whole answer, and it is the right one. None of the problems in this guide hands you a molar mass, so every formula asked for here is empirical. The molecular step is the one move in this toolbox the problems do not drill — which is why its arithmetic is written out above rather than merely named.
MIXTURES: CHOOSE THE EQUATION THE SAMPLE SUPPORTS
A nested-percent chain is powerful when a measured element appears in only one component. If component A is the only source of nitrogen, for example, then
That unique element is a bridge: all of the measured amount must have come through one component.
Do not turn that convenient design into a universal recipe. For a binary mixture of known components A and B, write the one-fraction model
One elemental measurement determines when because . More unknown components, unknown component compositions, or equal elemental fractions require more independent data. Count unknowns and independent relationships before declaring a mixture determined or underdetermined.
Purity is the same tool pointed at one component. Elemental analysis has two jobs in this topic: it fixes the relative numbers of atoms in a substance, and it measures how much of a sample is that substance. If a sample that should be pure ammonium sulfate assays at 20.3% nitrogen instead of the 21.20% the formula demands, the bridge chain gives the purity directly: , so the sample is 95.8% ammonium sulfate by mass and 4.2% something that carries no nitrogen. Report purity as a mass percent of the named component, and say what the balance is assumed to be.
ELECTRON CONFIGURATION
A configuration is an inventory: where every electron in the atom lives. Electrons occupy subshells, and each orbital can hold at most two electrons. The number of orbitals therefore sets each subshell’s maximum capacity:
| Subshell | Orbitals | Maximum electrons |
|---|---|---|
| s | 1 | 2 |
| p | 3 | 6 |
| d | 5 | 10 |
| f | 7 | 14 |
So the superscripts are not arbitrary — 2, 6, 10, 14 is just the orbital count, and a superscript larger than the capacity is an error you can catch on sight.
The fill order, without memorizing a string. Electrons go into the lowest-energy subshell available, but the energies interleave: 4s comes before 3d, 5s before 4d. Rather than memorize the sequence, build it. Write the subshells in a grid and read the diagonals:
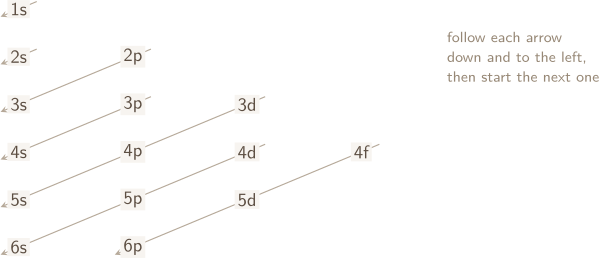
1s · 2s · 2p 3s · 3p 4s · 3d 4p 5s · 4d 5p 6s · 4f 5d 6p
Noble-gas shorthand. Bracket the nearest noble gas before your element, then list only what comes after it. stands in for the first 18 electrons. It saves writing and, more usefully, it puts the valence electrons where you can see them.
The operational 4s/3d rule. In the simplified Aufbau model used for first-row transition atoms, place 4s before 3d when building the neutral atom. When forming a cation, remove electrons from the occupied subshell with the highest principal quantum number first, so 4s electrons are removed before 3d electrons:
The underlying orbital energies are close and depend on electron occupancy and electron–electron interactions; a fixed two-line picture is not a literal account of every atom. For AP work, keep the two tasks separate: build the neutral configuration by the stated filling order, then remove from the highest first.
Anions need no special rule at all — just keep filling in the same order until the added electrons are placed.
Valence electrons, for main-group atoms, are the ones in the outermost — the s and p of that shell counted together. That count is what predicts the ion the atom forms.
Final step: audit the count. Count the electrons you actually placed and check the total against , adjusted for the charge. A neutral atom has electrons; each negative charge adds one; each positive charge removes one. This catches an incorrect total or charge, but it cannot detect electrons placed in the wrong subshell; check both the count and the placement rule.
3. USE A DISCONTINUITY AS EVIDENCE
Successive ionization energies rise moderately for the first three electrons, then jump sharply for the fourth. What does that suggest about the valence shell?
PHOTOELECTRON SPECTROSCOPY: A CONFIGURATION MADE VISIBLE
Photoelectron spectroscopy (PES) supplies photons of known energy to a gaseous sample and measures the kinetic energy of emitted electrons. Energy conservation gives the electron’s binding energy:
An electron that leaves with less kinetic energy required more energy to remove and therefore had the greater binding energy.
Read every PES representation in two directions. Horizontal position reports binding energy: core electrons lie at much greater binding energy than valence electrons. Peak area or relative intensity tracks how many electrons occupy that subshell. A peak therefore has about three times the area of an peak when the response per electron is treated alike. Check the printed axis before using left or right; PES axes are not always drawn in the same direction.
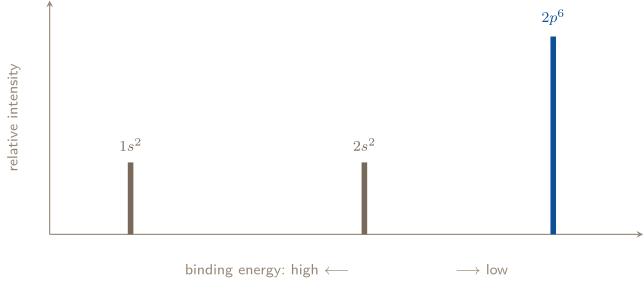
A schematic spectrum: peak count identifies occupied subshells; relative area checks electron count.
To compare two atoms, first match the same subshell. If the peak for that subshell moves to greater binding energy, those electrons are held more tightly. Across a period, added nuclear charge with little change in core shielding generally shifts corresponding peaks to greater binding energy. Do not compare unmatched peaks merely because they are adjacent on the page.
CHECK 3 — USE A DISCONTINUITY AS EVIDENCE
Three valence electrons. The first three come off the same outer shell and cost roughly comparable amounts; the fourth has to come out of a shell that is closer to the nucleus and much less shielded, and that is what the jump measures. Where the discontinuity falls counts the valence shell, so this atom sits in group 13. The size of any single ionization energy tells you far less than the place where the sequence breaks — read the gap, not the numbers.
COULOMB’S LAW RUNS THE PERIODIC TABLE
Many Unit 1 explanations — radius, ionization energy, electronegativity, ionic size, and PES binding energy — begin with the same question: how strongly is the nucleus attracting the electrons being compared? A useful electrostatic model is
For a many-electron atom, use effective nuclear charge, — the net positive charge an electron “feels” after shielding — as the charge comparison. The electron’s charge is fixed, and represents electron–nucleus distance. Charge, shielding, and distance are connected rather than perfectly independent, but separating them is a useful first-pass way to identify the dominant change.
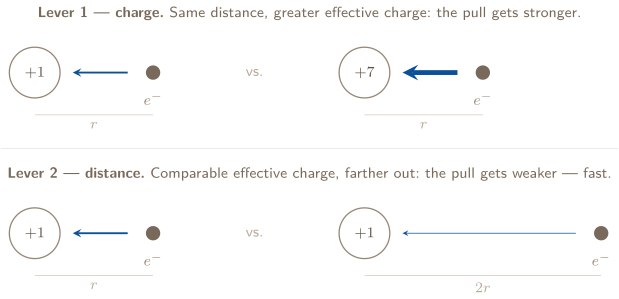
Arrow thickness is the strength of the pull, on one scale across both rows — so the -at- panel is the same picture top and bottom, and only the lever that moved differs. Doubling does not halve the force; it quarters it.
Estimating effective nuclear charge, quickly. The valence electron does not feel the full nuclear charge, because the core electrons between it and the nucleus screen part of that charge — shielding. The useful first-pass model for simple main-group comparisons is
Sodium: . Magnesium: . Chlorine: . This is a qualitative comparison, not an exact calculation: same-shell electrons also shield one another. Across Period 3, however, the core-electron count and principal valence shell stay the same while proton count rises, so generally rises.
The familiar arrows are broad patterns, not substitutes for evidence. Read the data in a prompt first, then use structure to explain the pattern:
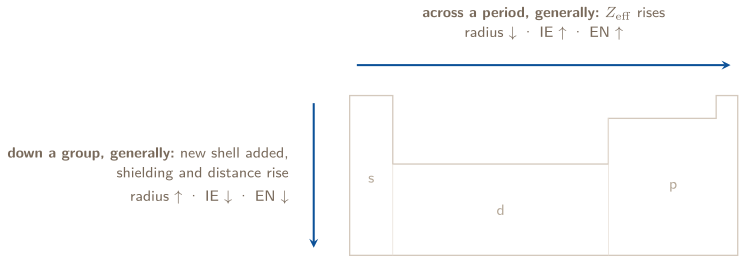
The mechanism behind the broad pattern:
| Across a period | Down a group |
|
|---|---|---|
| structure | more protons; same principal | new occupied shell; more |
| shell; core shielding changes little | shielding and distance |
|
| dominant effect | rises | distance rises |
| atomic radius | decreases | increases |
| ionization energy | generally increases | generally decreases |
| electronegativity | generally increases | generally decreases |
A reliable explanation pattern connects structural evidence to Coulombic attraction and then to the requested property:
Going from Na to Cl, the nuclear charge rises from 11 to 17 while the valence electrons stay in the same shell behind the same 10-electron core. Effective nuclear charge therefore rises, strengthening the attraction and pulling the valence-electron density inward, so atomic radius decreases.
The exact evidence required depends on the comparison. A circular statement such as “chlorine is smaller because its radius is smaller” supplies no mechanism; an explanation names the relevant structural change and connects it to attraction.
The two exceptions the exam asks about. First ionization energy generally rises across a period — and twice in Period 2 it does not. Both dips are real data, and both have a one-sentence mechanism:
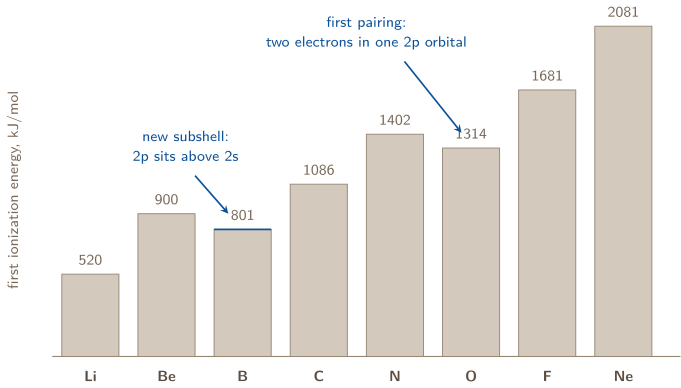
Period 2 first ionization energies, to the nearest kJ/mol. The two dips are the two places a memorized arrow gives the wrong answer.
Be B. Beryllium’s outermost electron is in 2s; boron’s is the first electron in 2p. Within the same shell the 2p electron is, on average, slightly farther from the nucleus and better shielded by the 2s pair than a 2s electron is by its partner, so it is held a little less tightly — even though boron has one more proton. Removing it costs 801 rather than 900 kJ/mol.
N O. Nitrogen’s three 2p electrons sit one per orbital. Oxygen’s fourth 2p electron must share an orbital with one of them, and two electrons confined to the same region repel. That repulsion lifts the paired electron’s energy, so it leaves more easily than nitrogen’s unpaired one: 1314 against 1402 kJ/mol, despite oxygen’s extra proton.
The same two mechanisms explain the same two dips in every period — Mg Al and P S in Period 3 — so learn the reasons, not the elements. And note what the CED excludes: you will not be asked to write the configuration of an aufbau exception such as chromium or copper; you will be asked to explain a trend’s exception with evidence.
IONS, ELECTRON AFFINITY, AND ANALOGOUS COMPOUNDS
Ionic radius needs its own comparison. A cation is generally smaller than its neutral atom because electrons were removed and the remaining cloud experiences a stronger attraction per electron. An anion is generally larger because added electron–electron repulsion expands the cloud. For an isoelectronic series, electron count and occupied shells are the same, so more protons means a smaller ion. Do not apply a neutral-atom arrow before checking charge and electron count.
Electron affinity describes the energy change when a gaseous atom gains an electron. Across a period it generally becomes more favorable (often described as more exothermic), while down a group it generally becomes less favorable, but subshell stability and electron repulsion create important exceptions. Some tables report energy released as a positive magnitude and others report the process enthalpy with a negative sign; read the convention printed with the data. When numerical data are supplied, the data outrank a memorized arrow.
Valence structure predicts common ions and analogous formulas. Main-group elements in one column share a valence-electron pattern, so they often form ions with the same charge. Balance total ionic charge to zero: with gives , and the same charge pattern predicts . “Analogous” does not mean identical. Atomic size, bond energies, physical state, surface condition, and activation barriers can change properties and reaction rates; use the actual evidence the prompt provides.
PROBLEM 1
The mole map: grams to moles to atoms
A sample of calcium nitrate, , has a mass of 5.86 g. (a) Compute the molar mass of . (b) How many moles of calcium nitrate is this? (c) How many nitrate ions does the sample contain? (d) How many oxygen atoms?
BEFORE YOU COMPUTE
Nothing here needs cleverness; it needs the map. Locate 5.86 g on it: that’s mass, the left edge. Parts (c) and (d) live on the right edge, so the route is fixed before any arithmetic starts: grams moles particles. And before the molar mass, count atoms deliberately — the subscript 2 belongs to the whole nitrate group: 1 Ca, 2 N, 6 O.
WORKING
(a) Count first, one element at a time. The subscript 2 sits outside the parentheses, so it multiplies both the N and the three O’s inside: 1 Ca, 2 N, O. Now the arithmetic, one line per element:
(b) Do not decide whether to multiply or divide — write the conversion factor so that the unit you are holding cancels, and let the page decide for you. You are holding grams and you want moles, so the factor goes in with grams on the bottom:
Grams cancel, moles survive. Unit cancellation catches an inverted factor: if the units of your answer come out wrong, the setup cannot be right. It does not replace checking that the numerical conversion factor itself is the one the chemistry requires.
(c) Now cross from the moles hub to the particle side. One mole of anything is of that thing, and here the “thing” is a formula unit of :
The formula is itself a conversion factor: two nitrate ions per formula unit, written the same way as any other:
(d) Same move, different subscript — six oxygen atoms per formula unit:
Cross-check, and see the whole route at once. Everything above is one chain of factors, and written as a single line it is the mole map traveled end to end. Nothing is left but the unit you asked for:
Two routes, same answer — that agreement is the verification, not a coincidence. Build the chain either way; the units police both.
ANSWER
(a) (b) (c) nitrate ions (d) oxygen atoms
WATCH OUT
Two failure modes own this topic. First, multiplying by the molar mass when you should divide — write the units on every line and let them decide; if 5.86 g of anything comes out as hundreds of “moles,” the units were trying to tell you. Second, the magnitude check: a gram-scale sample holds within a few powers of ten of particles. An answer of , or of , is not “close enough” — it is the map telling you a bridge was crossed backward.
CONNECTION
The map grows two spokes in Unit 3 and keeps every habit you used here: divide moles by molarity to reach a solution volume, multiply by the molar gas volume to reach a gas volume at STP. And in Unit 4 the hub is where stoichiometry lives — a balanced equation’s coefficients are a mole-to-mole factor, inserted between two trips across this same map. Learn the road once; the destinations multiply.
ABOUT THIS EXCERPT
This is the opening of a 49-page guide: the diagnostic tree, the full Master Toolbox, and the first worked problem. 9 more problems follow in the complete guide, each worked the same way — what to notice before you start, every step shown, and the mistake that problem invites. The complete guide is shared with families during the fit conversation.
Engineering Confidence — engineeringconfidence.one
Source and review notes
What this resource is
Complete browser edition of the public excerpt from an original Engineering Confidence AP Chemistry unit-reference packet. Every numerical problem and scenario was written for this guide.
- Published
- Last reviewed
- Printable edition
- 20 pages
Course reference: official College Board course page.
Read this public excerpt above, or save the PDF for printing and offline reading.
Download the 20-page PDF excerpt